
HI Market View Commentary 10-27-2025
Kevin, Please explain what a stock replacement strategy is with protection ?
Poor Man’s Collar trade= Leap Long Call with long puts and short calls in a shorter period of time
Leap Long Call with added long put protection as needed
Leap Bull Call Strategy = Leap Long Call with a Leap Short call
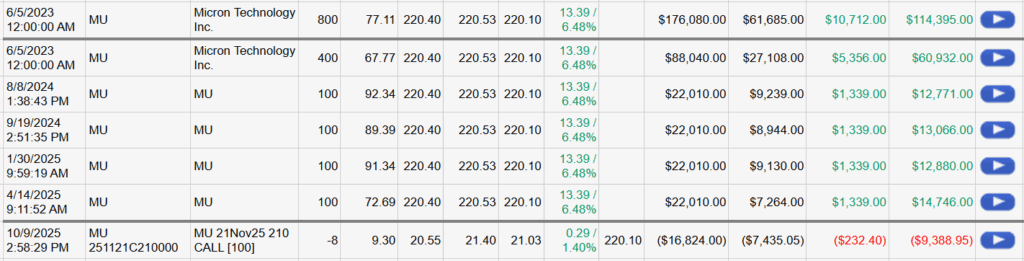
We want to invest some of the profits because even if it is WAY overvalued it still might go higher!!
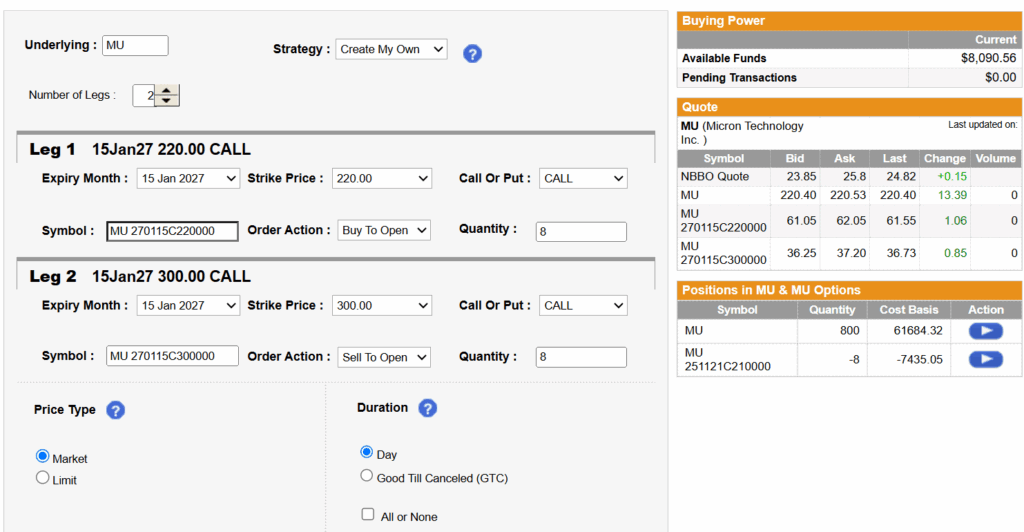
Jan 2027 Leap Bull Call
15 Jan 27 $220 Long Call = $61.55
15 Jan 27 $300 Short Call = $36.73
Net Cost Basis = Limit Debit $25
Maximum Return 300 – 220 = 80 – Cost Basis $25 = $55 net profit or a 2.2 to 1 Reward to Risk
IF MU returns to $160 I could probably take off the short call for $20 – $25 of profit
And then dollar cost average once
IF it fell I could also add a long put and make some more money on the way down
Earnings
AAPL 10/30 AMC
BA 10/29 BMO
BIDU 11/18 BMO
CB 10/21 AMC
DIS 11/13 BMO
GOOGL 10/29 AMC
KEY 10/16 BMO
LMT 10/21 BMO
MA 10/30 BMO
META 10/20 AMC
MSTR 10/30 AMC
MU 12/17 est
NVDA 11/29 AMC
O 11/03 AMC
PLTR 11/03 AMC
TGT 11/19 BMO
TXN 10/21 AMC
UAA 11/06 BMO
V 10/28 AMC
VZ 10/29 BMO
WMT 11/20 BMO
https://www.briefing.com/the-big-picture
The Big Picture
The Big Picture
Last Updated: 24-Oct-25 15:40 ET | Archive
Wall Street and Main Street diverge with K-shaped September CPI report
Briefing.com Summary:
*Wall Street’s popping champagne after the September CPI report; Main Street’s still clipping coupons.
*The Fed is going to cut rates on October 29, but not because it has slayed inflation.
*The 2026 COLA is 2.8%, below the current rate of inflation.
The much anticipated and long-awaited Consumer Price Index (CPI) for September was finally released, and when it was, there was a big exhale heard from Wall Street. Breathe in—here come the headlines. Breathe out—the headlines were better than feared.
Total CPI increased 0.3% month-over-month, while core CPI, which excludes food and energy, increased 0.2%. The market had been expecting increases of 0.4% and 0.3%, respectively, that would have left total CPI and core CPI both up 3.1% year-over-year. As it turned out, they were each up 3.0%.
It was a glorious report for a market that did not want any of this data to upset its vision of a rate cut at next week’s FOMC meeting. Well, it didn’t, and it won’t. Market participants can bank on a 25-basis-point cut in the target range for the fed funds rate to 3.75-4.00% on October 29.
Frankly, they already were. The CME FedWatch Tool showed a 98.3% probability of a 25-basis-point cut the day before the CPI report was released. In its wake, that probability now sits at 96.7%.
As glorious as the report was for Wall Street, you won’t hear the same exhale from Main Street. This was a K-shaped inflation report.
A Window Seat
Your author had a schedule conflict that got in the way of seeing the report released in real time. When there was time to review the details and hear the musings of others who had done the same already, it struck your author that there was a good bit of excitement that used car and truck prices decreased 0.4% month-over-month in September.
That was indeed a point of relief for anyone buying a used car or truck in September, yet there are some residual points that need to be made.
First, used car and truck prices were still up a hefty 5.1% year-over-year. Secondly—and this is the window to the K-shaped report argument—how often is one really buying a used car or truck? Answer: not often. Certainly not as often as one pays for food at home, food away from home, gas, utilities, apparel, rent, insurance, various other services, and medicine.
That is where Main Street is still holding its breath, waiting for more inflation relief. Let’s briefly take a look at where inflation sits with those items, with special attention on the year-over-year price changes.
| Item | M/M (%) | Yr/Yr (%) |
| Food at home | 0.3 | 2.7 |
| Food away from home | 0.1 | 3.7 |
| Gasoline | 4.1 | -0.5 |
| Electricity | -0.5 | 5.1 |
| Utility (piped gas) service | -1.2 | 11.7 |
| Apparel | 0.7 | -0.1 |
| Rent of shelter | 0.2 | 3.5 |
| Tenants’ and household insurance | 1.2 | 7.5 |
| Motor vehicle insurance | -0.4 | 3.1 |
| Wireless telephone services | 0.0 | -2.1 |
| Haircuts and other personal care | 0.9 | 4.6 |
| Laundry and dry cleaning | 0.3 | 4.9 |
| Pets, pet products and services | 0.8 | 3.5 |
| Household furnishing and supplies | 0.2 | 3.0 |
| Medicinal drugs | 0.0 | 0.6 |
Source: BLS
The good news is that the costs for gasoline, apparel, and wireless phone services are all less than they were a year ago. In other words, there was deflation in those key consumer categories. Collectively, though, it isn’t enough.
The table above captures 15 regular cost categories from the September CPI report. The average increase for these 15 categories is 3.4%. We don’t have the benefit of seeing the September employment report, which is still on ice due to the government shutdown, but the August report showed average hourly earnings up 3.7% year-over-year.
Employed consumers, therefore, are earning just enough to stay ahead of inflation, yet that doesn’t mean they aren’t feeling the pinch. If your earnings are up 3.7% year-over-year, but your electricity bill is up 5.1% year-over-year, that hurts.
Similarly, we doubt retirees dependent on Social Security payments or others needing Supplemental Security Income (SSI) were breathing a sigh of relief over the September CPI report. They learned after its release that their cost-of-living adjustment for 2026 will be 2.8%.
Maybe there will be a stronger disinflation trend in coming months, but for these recipients, there is going to be a primacy and recency bias that takes their breath away. The first thing they heard from the September CPI report is that inflation was up 3.0% year-over-year. The last thing they heard was that their COLA for 2026 is 2.8% (i.e., below the current rate of inflation).
Briefing.com Analyst Insight
Federal Reserve officials also heard inflation was up 3.0% year-over-year in September. That is well above the Fed’s 2.0% inflation target, which candidly is pegged to PCE inflation. Nevertheless, a 3-handle for CPI will be a lot for some of those officials to handle, not that it will stop them from agreeing to a rate cut on October 29.
They may not be so agreeable when the December FOMC meeting rolls around if there is still a 3-handle on inflation and the labor market isn’t showing material signs of weakness. That will be a fight for another day. Wall Street is content for now, knowing that the September CPI report went its way. Therefore, it will stick with the house view that inflation won’t heat up because of the tariffs or because the Fed is cutting rates, never mind that CPI inflation was 2.3% in April.
An impending rate cut is the one thing Wall Street and Main Street can cheer simultaneously on the other side of the September CPI report.
For Wall Street, picture both hands clapping with a lot of hootin’ and hollerin’. For Main Street, picture one hand clapping and only some hollerin’.
There is some welcome inflation on Wall Street, which can be seen in a 12-month gain of 17.1% for the S&P 500, and there is some not-so-welcome inflation on Main Street, which can be seen in a 3.0% year-over-year increase in CPI. That is the essence of the K-shaped September CPI report. Wall Street got what it wanted, while Main Street is still wanting.
—Patrick J. O’Hare, Briefing.com
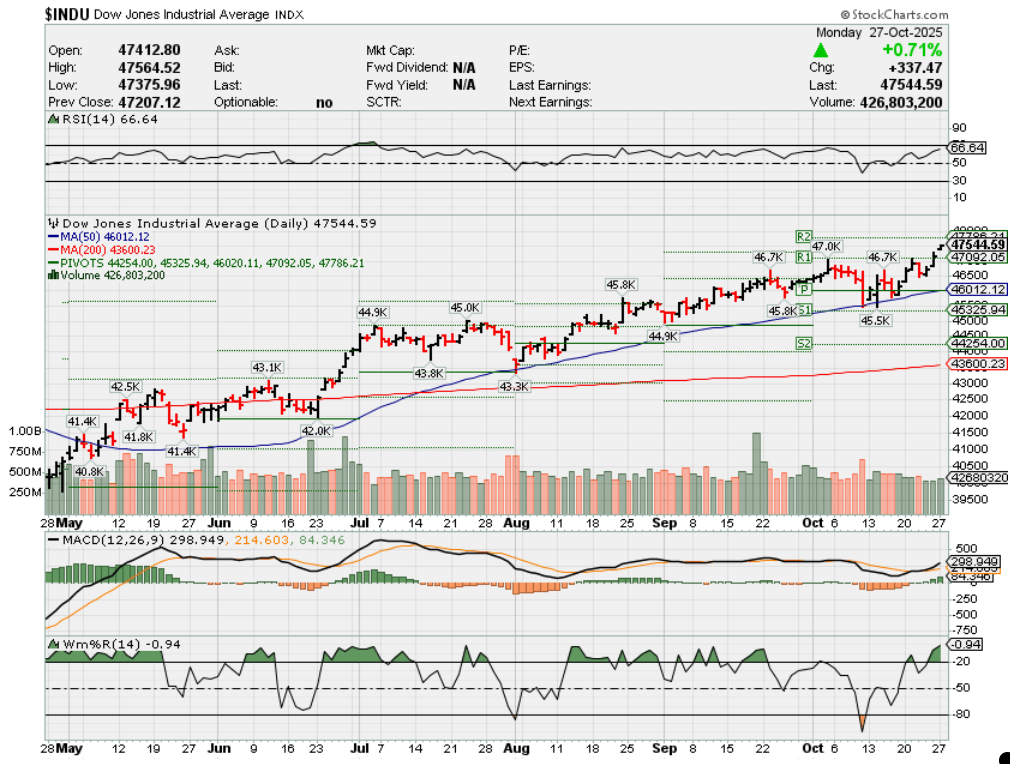
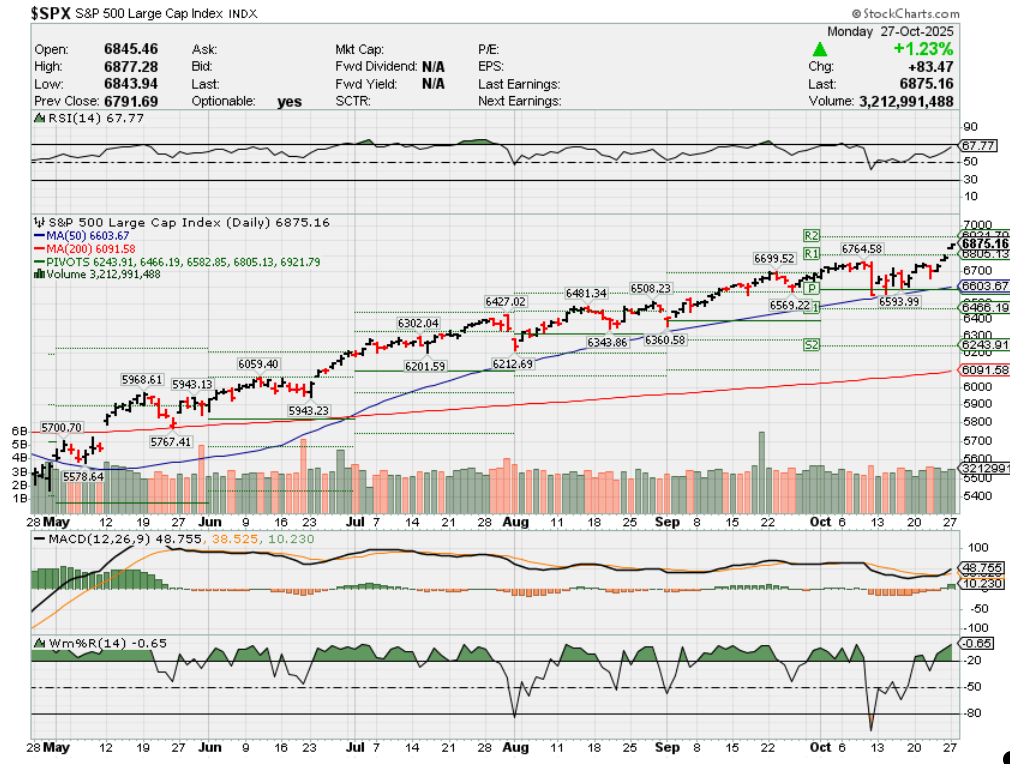
Where will our markets end this week?
Higher
DJIA – Bullish
SPX – Bullish
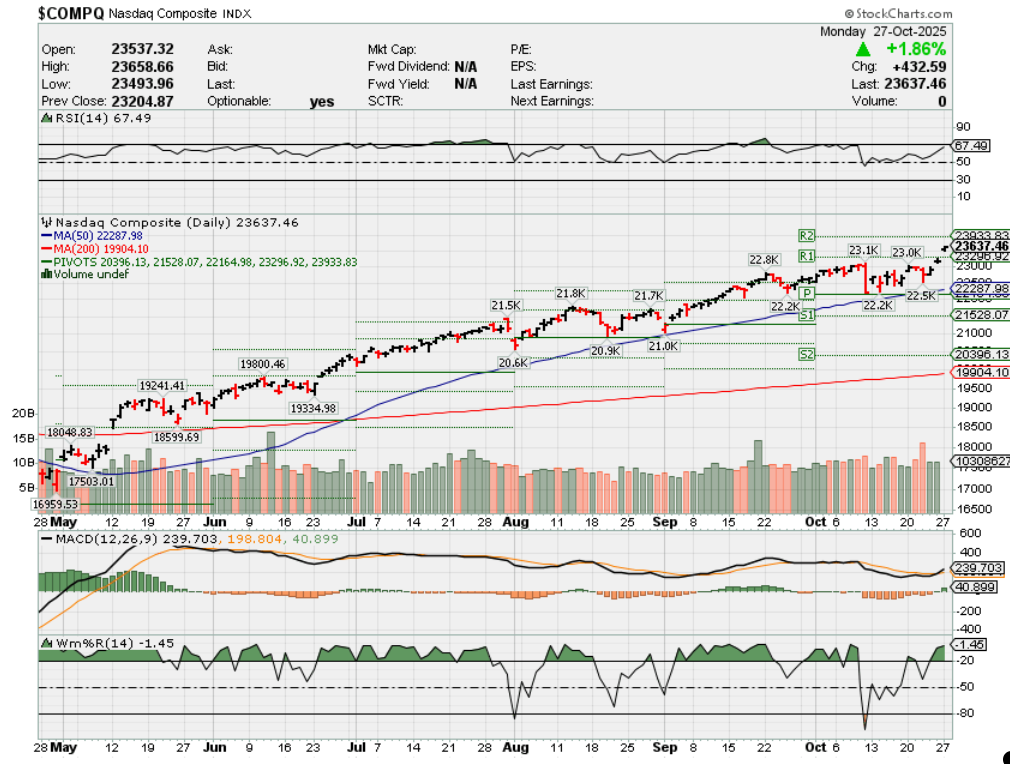
COMP – Bullish
Where Will the SPX end November 2025?
10-27-2025 +2.0%
Earnings:
Mon: KDP, BBBY, FFIV, NUE, RMBS, WM,
Tues: GLW, DHI, JBLUE, PYPL, UNH, UPS, EA, FLS, V
Wed: CAT, CVS, GEHC, KHC, PSX, CMG, EBAY, MGM, SBUX, RIG, BA, VZ, GOOGL, META, MSFT
Thur: BMY, CAH, CROX, LLY, EL, IP, KMB, SIRI, FSLR, ROKU, MO, MA, AAPL
Fri: CVX, CL, D, XOM, GWW
Econ Reports:
Mon: Durable Goods, Durable ex-trans,
Tue FHFA Housing Price Index, S&P Case Shiller, Consumer Confidence
Wed: MBA, FOMC Rate Decision,
Thur: Initial Claims, Continuing Claims, GDP, GDP Deflator,
Fri: PCE Prices, PCE Core, Employment Cost Index, Personal Income, Personal Spending, Chicago PMI
How am I looking to trade?
Time to start protecting for earnings
www.myhurleyinvestment.com = Blogsite
info@hurleyinvestments.com = Email
Questions???
Will AAPL continue = Yes probably but it will also sit around $300 for period of time
AAPL, BA, GOOGL, META, NFLX, MU, NVDA, PLTR (?), V, MSTR, AXP
Bank of America tops expectations on 43% surge in investment banking revenue
Published Wed, Oct 15 20256:15 AM EDTUpdated Wed, Oct 15 20255:03 PM EDT
Key Points
- Bank of America on Wednesday posted third-quarter results that exceeded analysts’ expectations on stronger-than-expected investment banking revenue.
- The second-largest U.S. bank by assets said profit rose 23% from a year earlier to $8.5 billion, or $1.06 per share.
- Revenue increased 10.8% to $28.24 billion.
Brian Moynihan, CEO of Bank of America, leaves the U.S. Capitol after a meeting with Republican members of the Senate Banking, Housing and Urban Affairs Committee on the issue of debanking on Thursday, February 13, 2025.
Tom Williams | Cq-roll Call, Inc. | Getty Images
Bank of America on Wednesday posted third-quarter results that exceeded analysts’ expectations on stronger-than-expected investment banking revenue.
Here’s what the company reported:
- Earnings per share: $1.06 vs. 95 cents expected, according to LSEG
- Revenue: $28.24 billion vs. $27.5 billion expected, according to LSEG
The second-largest U.S. bank by assets said profit rose 23% from a year earlier to $8.5 billion, or $1.06 per share. Revenue increased 10.8% to $28.24 billion.
Shares of the bank gained 4% Wednesday. They’ve climbed almost 19% so far this year.
Like its peers, Bank of America’s Wall Street businesses helped fuel the quarter’s results.
Banks including JPMorgan Chase and Goldman Sachs reported strong gains in trading and investment banking revenue during the third quarter on heightened activity among both institutional investors and corporations looking to acquire companies or raise capital.
Bank of America said investment banking fees surged 43% from a year earlier to $2 billion, about $380 million more than analysts surveyed by StreetAccount had expected.
Equities trading also contributed to the quarterly beat; revenue there rose 14% to $2.3 billion, roughly $200 million more than the StreetAccount estimate.
Fixed income trading rose 5% to $3.1 billion, matching expectations.
Bank of America also benefited from an improved outlook around credit losses in the quarter. The company said its provision for credit losses fell about 13% to $1.3 billion, which is below the $1.58 billion StreetAccount estimate.
Net interest income rose 9% to $15.39 billion, about $150 million more than the StreetAccount estimate.
“With continued organic growth, every line of business reported top and bottom-line improvements,” CEO Brian Moynihan said in the earnings release. “Strong loan and deposit growth, coupled with effective balance sheet positioning, resulted in record net interest income.”
This story is developing. Please check back for updates.
Tariff items that have significantly raised prices include coffee (up over 20%), lingerie, washing machines, and clothing (some leggings up nearly a third). Other products with notable price increases include some tech items like Playstation 5 (+$11.76) and iPhones, luxury goods such as a Louis Vuitton tote bag (+$100), and building materials like steel, aluminum, and lumber, which can lead to higher home prices.
Food and agricultural products
- Coffee: Prices have jumped more than 20% in the last year.
- Bananas: Prices have risen significantly.
- Beef: Ground beef prices have increased by 12.9% in September 2025 compared to the previous year, according to CBS News.
- Candy: Some candy packs are up by over 10%, with specific products like Tootsie Roll lollipops seeing a nearly 34% increase, according to The Century Foundation.
Electronics and technology
- iPhones and other Apple products: Analysts predict costs could skyrocket by as much as 43% due to tariffs on goods from China and other countries.
- Playstation 5: One analysis found a price increase of over $11.76 per unit.
Appliances and household goods
- Washing machines: Prices rose by about 12% ($86 per unit) due to 2018 tariffs, reports CNBC. A specific example showed a Whirlpool washing machine increasing by nearly $82.
- Clothing: Some items, like a pair of Target Cat and Jack leggings, went up by nearly a third.
Apparel and accessories
- Jeans: One example showed a price increase of over $11.76.
- Shoes: Tariffs starting at a minimum of 19% in countries like China, Vietnam, and Indonesia are driving up prices, according to CNN.
- Watches: A 31% reciprocal tariff on Swiss imports has a significant impact on luxury watch prices.
Building materials and luxury goods
- Steel, Aluminum, and Lumber: Tariffs on these key building materials could lead to higher home prices.
- Louis Vuitton tote bag: One analysis found a medium Neverfull tote increased by $100.
U.S. and China talks sketch out rare earths, tariff pause for Trump and Xi to consider
Published Sun, Oct 26 20257:17 AM EDTUpdated Sun, Oct 26 20256:43 PM EDT
Top Chinese and U.S. economic officials on Sunday hashed out the framework of a trade deal for U.S. President Donald Trump and Chinese President Xi Jinping to decide on later this week that would pause steeper American tariffs and Chinese rare earths export controls, U.S. officials said.
U.S. Treasury Secretary Scott Bessent said talks on the sidelines of the ASEAN Summit in Kuala Lumpur had eliminated the threat of Trump’s 100% tariffs on Chinese imports starting Nov. 1. Bessent also said he expects China to delay implementation of its rare earth minerals and magnets licensing regime by a year while the policy is reconsidered.
Chinese officials were more circumspect about the talks and offered no details about the outcome of the meetings.
Trump and Xi are due to meet on Thursday on the sidelines of the Asia-Pacific Economic Cooperation (APEC) summit in Gyeongju, South Korea, to sign off on the terms. While the White House has officially announced the highly anticipated Trump-Xi talks, China has yet to confirm that the two leaders will meet.
“I think we have a very successful framework for the leaders to discuss on Thursday,” Bessent told reporters after he and U.S. Trade Representative Jamieson Greer met with Chinese Vice Premier He Lifeng and top trade negotiator Li Chenggang for their fifth round of in-person discussions since May.
Bessent said he anticipates that a tariff truce with China will be extended beyond its November 10 expiration date, and that China will revive substantial purchases of U.S. soybeans after buying none in September while favoring soybeans from Brazil and Argentina.
U.S. soybean farmers “will feel very good about what’s going on both for this season and the coming seasons for several years” once the deal’s terms are announced, Bessent told the ABC program “This Week.”
Greer told the “Fox News Sunday” program that both sides agreed to pause some punitive actions and found “a path forward where we can have more access to rare earths from China, we can try to balance out our trade deficit with sales from the United States.”
Trump expects a deal, Chinese suggest caution
China’s Li Chenggang said the two sides reached a “preliminary consensus” and will next go through their respective internal approval processes.
“The U.S. position has been tough, whereas China has been firm in defending its own interests and rights,” Li said through an interpreter. “We have experienced very intense consultations and engaged in constructive exchanges in exploring solutions and arrangements to address these concerns.”
Trump arrived in Malaysia on Sunday for a summit of the Association of Southeast Asian Nations, his first stop in a five-day Asia tour that is expected to culminate in Thursday’s face-to-face with Xi in South Korea.
After the weekend talks, Trump struck a positive tone, saying: “I think we’re going to have a deal with China.”
Trump had threatened new 100% tariffs on Chinese goods and other trade curbs starting on Nov. 1, in retaliation for China’s expanded export controls on rare-earth magnets and minerals.
China controls more than 90% of the world’s supply of the materials, which are essential for high-tech manufacturing from electric vehicles to semiconductors and missiles. The export controls and Trump’s threatened retaliation would disrupt a delicate six-month truce under which China and the U.S. reduced tariffs that had quickly escalated to triple-digit rates on each side.
The U.S. and Chinese officials said that, in addition to rare earths, they discussed trade expansion, the U.S. fentanyl crisis, U.S. port entrance fees and the transfer of TikTok to U.S. ownership control.
Bessent told NBC’s “Meet the Press” program that the two sides have to iron out details of the TikTok deal, allowing Trump and Xi to “consummate the transaction” in South Korea.
Talking points with Xi include soybeans, Taiwan
On the sidelines of the ASEAN Summit, Trump hinted at possible meetings with Xi in China and the United States.
“We’ve agreed to meet. We’re going to meet them later in China, and we’re going to meet in the U.S., in either Washington or at Mar-a-Lago,” Trump said.
Among Trump’s talking points with Xi are Chinese purchases of U.S. soybeans, concerns around democratically governed Taiwan, which China views as its own territory, and the release of jailed Hong Kong media tycoon Jimmy Lai.
The detention of the founder of the now-defunct pro-democracy newspaper Apple Daily has become the most high-profile example of China’s crackdown on rights in Hong Kong.
Trump also said he will seek China’s help in U.S. dealings with Moscow, as Russia’s war in Ukraine grinds on.
Tensions between the world’s two largest economies flared in the past few weeks as a delicate trade truce, reached after a first round of trade talks in Geneva in May and extended in August, failed to prevent the United States and China from hitting each other with more sanctions, export curbs and threats of stronger retaliatory measures.
China’s expanded controls on rare-earths exports have caused a global shortage. That has prompted the United States to consider a ban on software-powered exports to China, from laptops to jet engines, according to a Reuters report.
Amazon Outage Takes Down “Half the Internet”
By Tanya Stoyanovich • Oct. 20, 2025
A widespread failure at Amazon Web Services knocked out access to countless online services early Monday, leaving users frustrated and businesses scrambling. Reports flooded in starting around 1 a.m. ET, with platforms like Snapchat, Fortnite, Roblox, and Duolingo grinding to a halt for millions.
The disruption extended beyond social media and games, hitting smart home devices such as Ring doorbells and Alexa speakers, as well as banking apps and delivery services. DownDetector logged tens of thousands of complaints, painting a picture of chaos that rippled through daily routines—from parents unable to monitor their homes to gamers mid-session losing connections.
Amazon confirmed the issue on its status page: “We are investigating increased error rates and latencies for multiple AWS services in the US-EAST-1 Region.” Later updates indicated they had “identified a potential root cause” but offered no further details on what sparked the breakdown.
This isn’t the first time AWS has faltered, but the scale raises questions about the dangers of putting so much power in the hands of one company. With Amazon controlling a massive chunk of the cloud infrastructure that underpins the modern economy, a single point of failure can paralyze everything from e-commerce to essential communications. Critics have long warned that this centralization invites trouble, whether from simple errors or something more sinister.
Online forums buzzed with speculation as the outage dragged on. Some users pointed to recent geopolitical tensions, suggesting a cyber intrusion by state actors aiming to sow discord. Others floated ideas of deliberate throttling tied to corporate rivalries or regulatory pressures, especially amid ongoing antitrust scrutiny of Big Tech giants. While officials haven’t confirmed any foul play, the timing—coming amid heightened alerts for digital threats—fuels doubts that it was just a routine glitch.
Recovery efforts appeared underway by mid-morning, with services trickling back online. Yet the incident serves as a stark reminder of how fragile our interconnected world has become. Families rely on these tools for security and education, while small businesses depend on them for operations. When the backbone buckles, it exposes vulnerabilities that no amount of innovation seems to fully address.
As investigations continue, calls for diversification in cloud providers grow louder, emphasizing the need to avoid over-dependence on monopolistic entities that hold the keys to so much of our digital lives.
Is the Stock Market Overvalued Right Now?
Written by Clark.com Staff | October 26th, 2025
When people say the stock market is “expensive” or “overvalued,” what does that actually mean?
You’ve probably heard these terms on the news or from financial advisors, and maybe nodded along thinking you understood. But let’s break down what’s really being said — because understanding this concept is crucial to being a smart investor.
A Simple Analogy: The Dairy Farm
Imagine buying a farm that produces 100,000 gallons of milk per year. Each gallon sells for $2.50, so after all expenses, the farm makes $100,000 in profit annually.
Now, how much would you pay for this farm?
- Scenario 1: You pay $1,000,000 for the farm. At $100,000 profit per year, it would take 10 years of profits to earn back what you paid. We’d say you bought the farm at “10 times earnings” or “10×.”
- Scenario 2: Lots of people want to buy farms, and competition drives up the price. You end up paying $3,000,000 for the same farm. Same cows. Same milk. Same $100,000 annual profit. But now it takes 30 years of profits to earn back what you paid. You bought at “30 times earnings” or “30×.”
The farm hasn’t changed. The only difference is the price you paid. That’s what it means for something to be “overpriced” or “overvalued” — you’re paying more for the same productive asset.
Here’s the kicker: If you decide in a few years you want to sell this farm, and by then other farm buyers have wised up and are only willing to pay 15× earnings, you’ll only get $1,500,000 back — a 50% loss, even though the farm itself is still producing the same milk.
How This Relates to the Stock Market
A company’s stock works the same way. When you buy stock, you’re buying a share of that company’s future profits. The “price-to-earnings ratio” (or P/E ratio) tells you how many years of current profits you’re paying for.
- A stock trading at 10x earnings costs $10 for every $1 of annual profit
- A stock at 30x earnings costs $30 for every $1 of annual profit
- A stock at 50x earnings costs $50 for every $1 of annual profit
The higher the number, the more expensive the stock is relative to what it actually earns today.
Where Are We Historically?
Over the past 100 years, the stock market (measured by the S&P 500) has typically traded at around 15-17x earnings. That’s been the long-term average, with some variation above and below depending on economic conditions.
In October 2025, the S&P 500’s P/E ratio is 25x, but it hit 30x last month.
That means investors today are paying nearly double what they’ve historically paid for the same dollar of corporate earnings. It’s not the highest it’s ever been — during the late 1990s tech bubble, it briefly exceeded 40x — but it’s definitely expensive by historical standards.
Another metric economists watch, called the cyclically adjusted P/E ratio (or “CAPE ratio”), which smooths out earnings over 10 years to account for economic cycles, tells a similar story. It currently stands at 39.51, which is 124% above its historic average of 17.6.
Even Federal Reserve Chairman Jerome Powell weighed in, stating in September 2025 that stocks are “fairly highly valued” by many measures.
But Wait — Maybe There Are Good Reasons for Higher Valuations?
Here’s where it gets more nuanced. Just because something costs more than it used to doesn’t automatically mean the price is wrong. There might be legitimate reasons why today’s businesses command higher valuations than businesses did decades ago.
Today’s Companies Are More Profitable
In the 1980s and 1990s, the average S&P 500 company had profit margins around 6-7% — meaning for every dollar of sales, they kept 6-7 cents as profit. Today, those margins are closer to 11-12%. Companies are simply more profitable than they used to be. If a business makes more money per dollar of sales, paying a higher multiple makes mathematical sense.
They Can Scale Globally and Efficiently
A retailer in 1985 needed to build physical stores in every city to grow. That required massive capital investment, inventory in each location, and local staff everywhere. Today, a company like Amazon can reach customers worldwide with essentially the same infrastructure. Software companies can sell to one customer or one million customers without building new factories. This ability to scale means future growth potential is genuinely larger — and that’s worth something.
Winner-Take-All Economics
Technology has created markets where one or two companies can dominate globally. Google handles over 90% of internet searches worldwide. These network effects — where a product becomes more valuable as more people use it — create economic advantages that previous generations of companies couldn’t achieve. A dominant position in a winner-take-all market is worth more than a strong position in a fragmented market.
The Economy Has Fundamentally Changed
In 1975, tangible assets — factories, equipment, inventory — made up 83% of the S&P 500’s value. By 2020, that had flipped: intangible assets like software, patents, brands, and data made up about 90% of corporate value.
Intangible assets can scale infinitely at near-zero marginal cost. Microsoft doesn’t need to manufacture physical products to sell to each new customer. This fundamentally changes the economics of what makes a company valuable.
So… Should Valuations Be Higher Today?
The honest answer: maybe. The economy has changed. Business models have changed. Profitability has improved. It’s reasonable to argue that 15-17× was the right valuation for 1985, but perhaps 20-22x is the right valuation for 2025.
The problem is we don’t know for sure. And even if higher valuations are somewhat justified, that doesn’t mean 25-30x is the right number. We might be at fair value, or we might be in a bubble. History will tell us eventually — but only after the fact.
The Market Isn’t One Price — It’s Thousands of Them
Here’s something crucial that often gets lost: When people say “the market is overvalued,” they’re talking about an average. The S&P 500 is 500 different companies, each with its own valuation.
Right now, the market looks expensive largely because its biggest members are very expensive. The top 10 companies in the S&P 500 now make up nearly 40% of the entire index’s value. Many of these mega-cap tech companies trade at valuations well above the market average:
- NVIDIA: ~50x earnings
- Tesla: nearly 200x earnings
- Microsoft: ~37x earnings
- Apple: ~35x earnings
- Even “cheaper” mega-caps like Alphabet: ~23x earnings
Because these companies are so large, their high valuations pull the entire market average higher. But thousands of other stocks trade at much more reasonable prices.
This means you have choices. If you’re concerned about overpaying, you don’t have to abandon stocks entirely — you can be selective about which stocks you own.
Not Everything Is Expensive
While big tech stocks command premium prices, many other sectors and companies trade closer to — or even below — historical norms:
- Financial stocks often trade at 10-15x earnings
- Energy companies frequently trade at single-digit multiples
- Many industrial and consumer goods companies trade at reasonable valuations
- International stocks, particularly in Europe and emerging markets, trade at significant discounts to U.S. stocks
These aren’t necessarily better investments — there are usually reasons why they’re cheaper (slower growth, more cyclical earnings, different risks). But if you’re specifically worried about overpaying, these areas offer alternatives.
The International Opportunity: Cheaper Valuations, Different Risks
Here’s a striking fact: While the U.S. stock market trades at 25-30x earnings, developed international markets (Europe, Japan, Australia) trade around 14-16× earnings, and emerging markets often trade below 12x earnings. That’s less than half the U.S. valuation.
Why the huge gap? There are legitimate reasons:
- Slower economic growth: The U.S. economy has consistently grown faster than Europe and Japan over the past two decades
- Less innovation concentration: The U.S. dominates in high-growth tech sectors; international markets have more exposure to traditional industries
- Political and regulatory uncertainty: Different governance structures, more regulation, and sometimes less shareholder-friendly policies
- Currency risk: Returns can be affected by changes in exchange rates
But here’s what makes the current environment interesting: International stocks are much less likely to experience a severe crash precisely because they’re not priced for perfection.
International stocks have already been beaten down. European stocks, for instance, have dramatically underperformed U.S. stocks for over a decade. Much of the bad news — slower growth, regulatory challenges, geopolitical risks — is already reflected in the lower prices. They’re not priced for a miracle; they’re priced for modest expectations.
This doesn’t mean international stocks can’t fall — everything falls in a global panic. But the risk of a 50% crash is much lower when valuations are already moderate. And if those economies and companies perform even slightly better than the low expectations built into current prices, the upside could be significant.
Adding international exposure (through index funds or ETFs) gives you both geographic diversification and valuation diversification — you’re not putting all your eggs in the expensive U.S. basket.
The catch: If there’s a major market crash triggered by those overvalued mega-cap stocks, it will likely drag down everything else temporarily, even fairly priced stocks. Panic is indiscriminate. But over time, companies bought at reasonable valuations tend to recover faster and deliver better long-term returns.
Lessons From the 2000 Tech Bubble: What’s Similar and What’s Different
The last time U.S. stock valuations hit extremes was the dot-com bubble of the late 1990s and early 2000s. Enthusiasm for internet companies drove prices far beyond what profits could support. Many companies went public without any earnings — some without even a clear path to revenue — and yet their stock prices soared.
When the bubble burst in 2000, the NASDAQ fell nearly 80% from its peak, wiping out trillions in paper wealth. The S&P 500 lost almost half its value before bottoming out in 2002.
What’s Similar Today
Tech Leadership: Just like in 2000, today’s market is heavily driven by a handful of tech companies. In the late ’90s, it was Cisco, Intel, and AOL; today it’s Apple, Microsoft, NVIDIA, and other AI-linked names.
Investor Excitement Around Innovation: Back then, it was the internet revolution; today, it’s artificial intelligence and cloud dominance. Both are transformative technologies that create genuine excitement and optimism.
Concentrated Market Gains: A small group of companies has accounted for the majority of stock market returns. In 1999, the top 10 stocks dominated the S&P 500; the same is true now.
What’s Different This Time
Earnings Power: Many of today’s leading tech companies are highly profitable, with real cash flow and dominant business models. In 2000, most internet companies had little or no earnings to justify their valuations. You literally couldn’t calculate P/E ratios because the “E” (earnings) was zero — or negative.
Valuation Levels: While valuations are high compared to historical averages, they’re not as extreme as they were in 2000. At the peak of the dot-com bubble, the NASDAQ’s P/E ratios were effectively infinite for many firms because there were no profits at all. Today at 25-30x, we’re expensive — but we’re paying for real earnings.
Balance Sheets: Today’s tech giants hold massive amounts of cash and relatively low debt, giving them resilience that dot-com startups lacked. Apple alone has roughly $150 billion in cash. These aren’t fragile companies, one bad quarter away from bankruptcy.
Adoption vs. Hype: In 2000, the internet was still in its infancy — fewer than half of Americans were online. Today, AI, cloud computing, and mobile technology already generate hundreds of billions in real revenue. The infrastructure is built and working, even if future growth assumptions may still be aggressive.
What You Can Do When the Market Is Expensive
Hearing that stocks are “overvalued” can make investors nervous. But high prices don’t necessarily mean a crash is coming tomorrow — markets can stay expensive for years. Here are practical steps to consider:
Do Nothing — Stay the Course and Keep Contributing
If you have a long investment horizon (10+ years), the smartest move is often to just keep going. That means staying invested and continuing your regular contributions. By doing so, you’re dollar-cost averaging — buying shares at all kinds of price levels, expensive and cheap alike.
Over time, this approach has worked far better than trying to time the market. The investors who sold in 1996 because stocks looked expensive missed the massive gains of 1997-1999. Yes, they also missed the crash — but by the time the market recovered in 2007, the person who just kept investing the whole time came out far ahead.
Amazon to announce largest layoffs in company history, source says
Published Mon, Oct 27 20254:03 PM EDTUpdated 3 Hours Ago
Annie Palmer@in/annierpalmer/@annierpalmer
Key Points
- Amazon will begin a fresh round of job cuts beginning Tuesday, CNBC has learned.
- The layoffs will amount to the largest cuts to Amazon’s corporate workforce in the company’s history, according to a person familiar with the matter.
- The company conducted rolling layoffs across the company since 2022, which has resulted in more than 27,000 employees being let go.
The layoffs will amount to the largest cuts to Amazon’s corporate workforce in the company’s history, spanning almost every business, according to a person familiar with the matter, who asked not to be named because the details are confidential.
Amazon is expected to begin informing employees of the layoffs via email Tuesday morning, the person said.
The company plans to lay off as many as 30,000 staffers across its corporate workforce, according to Reuters, which first reported the news.
Amazon declined to comment.
Amazon is the nation’s second-largest private employer, with more than 1.54 million staffers globally as of the end of the second quarter. That figure is primarily made up of its warehouse workforce. It has roughly 350,000 corporate employees.
The planned layoffs would also represent the biggest job cuts across the tech industry since at least 2020, according to Layoffs.fyi. As of Monday, more than 200 tech companies have laid off approximately 98,000 employees since the start of the year, according to the site, which monitors job cuts in the tech sector.
Microsoft has laid off about 15,000 people so far this year, while Meta last week eliminated roughly 600 jobs within its artificial intelligence unit. Google cut more than 100 design-related roles in its cloud unit earlier this month, and Salesforce CEO Marc Benioff said in September the company laid off 4,000 customer support staffers, pointing to its increasing AI adoption as a catalyst behind the cuts. Intel’s cuts this year totaled 22,000 jobs, the most of any listed by Layoffs.fyi.
The steepest year for job cuts in tech came in 2023, as the industry reckoned with soaring inflation and rising interest rates. Close to 1,200 tech companies slashed over 260,000 jobs, the site said.
Over the past year, companies across industries including tech, banking, auto and retail have also pointed to the rise of generative AI as a force that’s likely to or already changing size of their workforces.
Amazon has conducted rolling layoffs across the company since 2022, which has resulted in more than 27,000 employees being let go. Job reductions have continued this year, though at a smaller scale. Amazon’s cloud, stores, communications and devices divisions have been hit with layoffs in recent months.
The layoffs are part of a broader cost-cutting campaign by Amazon CEO Andy Jassy that began during the Covid-19 pandemic. Jassy has also moved to simplify Amazon’s corporate structure by having fewer managers in order to “remove layers and flatten organizations.”
Jassy said in June that Amazon’s workforce could shrink further as a result of the company embracing generative AI, telling staffers that the company “will need fewer people doing some of the jobs that are being done today, and more people doing other types of jobs.”
“It’s hard to know exactly where this nets out over time, but in the next few years, we expect that this will reduce our total corporate workforce,” Jassy said in the June memo to staff.